PPT这款软件相信大家都有些了解的,制作图表的一个好帮手哦。那么假如要绘制山峰柱状图表,我们应该如何去操作呢?下面小编就带来了PPT绘制山峰柱状图表的教程哦,一起去看看吧。
打开PPT,插入一个ppt默认的柱状图。
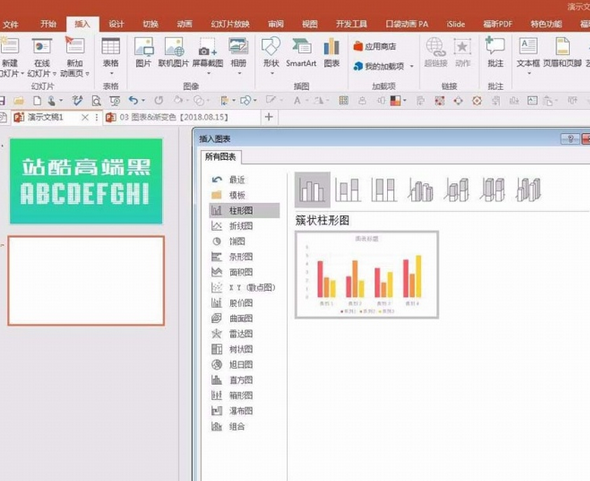
然后修改数据。只保留一个类别,多个系列。

再去掉自带多余修饰成分。比如网格线、标题、图例、坐标轴等。

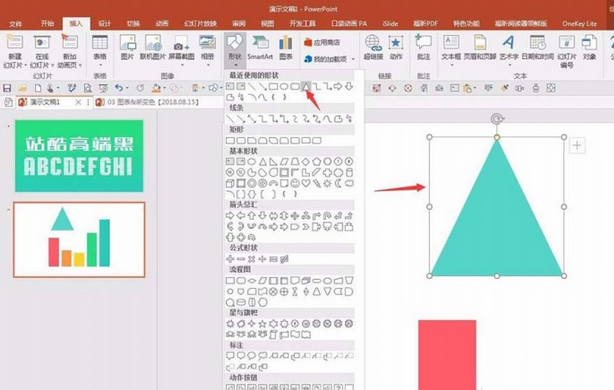
下面绘制一个等腰三角形,作为后续使用的山峰辅助图。适当画大些、高些,并设置填充透明度,如20%。
这时在三角形上右键单击“编辑顶点”。
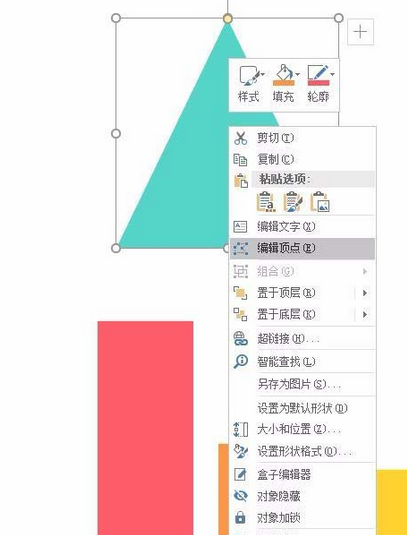
单击顶部顶点编辑点,右键选择“平滑顶点”。顶点就变成弧形了。

这时点击三角形左下角的顶点,出现控制柄,往右拖动控制柄改变为弧形。
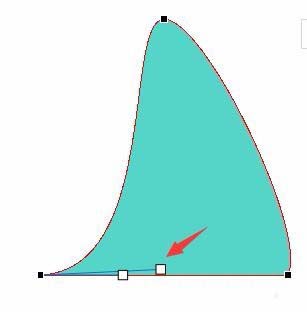
同理,对三角形右下角顶点进行同样操作。山峰样子出来了。这时再选中山峰,ctrl+c复制,点击其中一个柱子,再ctrl+v粘贴。

改变山峰的填充颜色,复制到其他的柱子。得到初步效果。

再任意点击一个柱子,右键单击选择“设置数据系列格式”,右侧打开格式设置窗口。
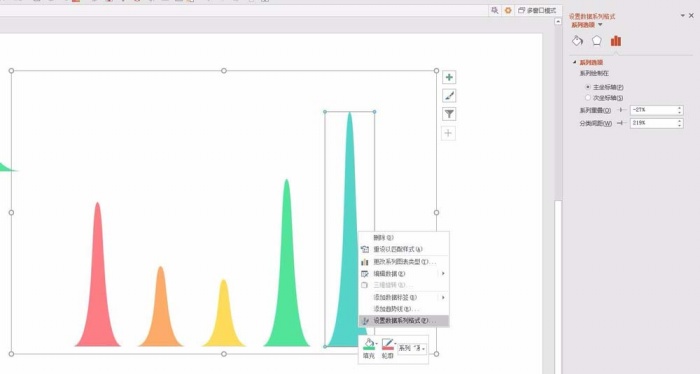
最后在右侧格式设置窗口中调整“系列重叠”和“分类间距”,得到最终效果。

以上这里为各位分享了PPT绘制山峰柱状图表的简单步骤。有需要的朋友赶快来看看本篇文章吧。


